

Experimental Plough Zone Archaeology
Experimental Plough Zone Technology
A copy of the poster exhibited at the WAC conference in Dublin in Ireland in 2008
Download full paper in PDF format >
THE RESEARCH QUESTIONS
- What distance can stone artefacts placed on the surface, be displaced in three seasons of normal cultivation practice?
- What are the percentages of stone artefacts that appear on the surface after each cultivation episode?
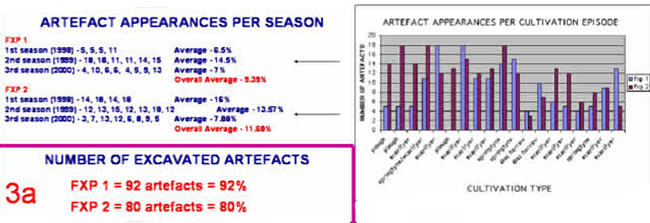
- (a) How many stone artefacts can be recovered by excavation after three seasons of cultivation and,
(b) what damage can be seen on recovered artefacts? - Has the size of the artefact have an influence on the distance it has travelled from their original position?
- What is the spread (linear and non-linear wise) of stone artefact positions after three sessions of cultivation?
MATERIALS
Materials used in this experiment can be divided into two sections.
- Stone Artefacts
- Farming Implements
 1. Stone Artefacts
The raw materials for the stone artefacts for this research were gathered over a number of years from various localities from Southeast Australia and used by myself and an archaeological colleague, Mrs Jan Wilson, for experimental knapping for another project. In all 200 artefacts were used for this research. Some were made especially for the experiment, while others were scavenged from the experimental knapping pit.
The raw materials selected for this research covered a variety of materials, colours and sizes to represent a lifelike range of colours and raw materials found in Southeast Australia. According to my archaeological knowledge, all these raw material have been used by Aboriginal knappers in the past in Australia.
Example of Stone Artefacts Used >
2. The Farming Implements

SETTING UP THE EXPERIMENT
Prior to being distributed on the experiment sites, the stone artefacts selected were analysed with nine attributes being recorded. These were:
1. An identification number which reflected the coordinates of their position (each were marked with marking pen and their site designation and individual ID eg 2 A1 ie. Site 2 artefact A1)
2. Type of artefacts (flake, core etc)
3. Raw material
4. Colour
5.,6., 7. Maximum length, maximum width and maximum thickness
8. Presence or absence of cortex
9. Percentage of cortex (if present).
The artefacts were then photographed in groups of 25 as they were to be placed in a square metre frame in each site (eg. A1-A25, B1-B25, C1-C25, D1-D25).
The metal frame, which was strung at 10cm intervals between opposite sides, was constructed to accurately place the artefacts in their own 10x10cm square, the square meter frame was placed parallel to the boundary fence in each site and a wooden post in the fence was used as a base marker. The square metre frame enclosing the artefacts was placed a number of metres away from the boundary fence in each site, so that the marking pegs could be left in place between the fence and the cultivation area. This enabled the square metre frame to accurately be placed again after each cultivation and to accurately measure the distances travelled by the artefacts found on the surface. The 100 randomly selected artefacts were individually placed in their own 10x10cm square within the square metre frame in each site.
After each cultivation, the square metre frame was placed back in its original positions and all artefacts sighted on the surface were recorded as to their position and distance from their original starting position. (ie. the centre of each 10cm square). The site was also inspected before the next cultivation to ascertain if rain had revealed any other artefacts. If it had, then these artefacts were also recorded. Cultivations took place in the normal fashion of a farm, that is, after rain which allows weeds to grow, or after harvest in preparation for the next season’s crop. No tillage equipment was pulled at speeds of more than 5mph (8km) per hour by either tractor. This was generally the speed limit for tractors constructed and used on the western slopes of NSW between 1930 and 1950.
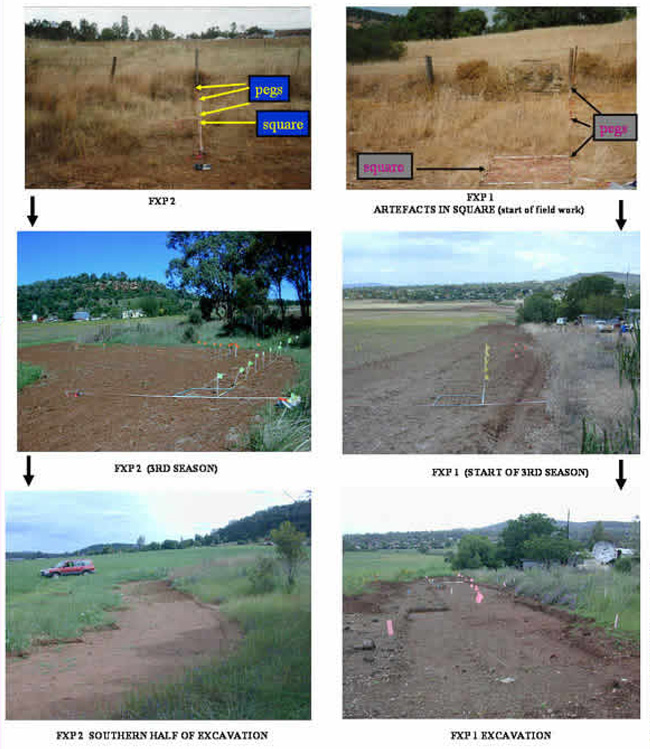
The path of the excavation followed the general line that the artefacts had been recorded on over the three seasons. The area excavated expanded laterally in each site to ensure artefacts had not travelled outside the expected areas. All squares were excavated to the bottom of the plough zone. The bottom of the plough zone in all cases, was hard and devoid of decaying vegetable matter and was easily distinguished form the overlaying cultivated soil. Each section was initially dry seived using plastic 5mm seiveds. Only for a few days after heavy rain did the deposit in site ‘FXP 1 ‘need wet sieving as the soil in this site was very looks and tended not to cling to stone. the soil in site ‘FXP 2’, however, was a heavy red clay type and soil stuck to all stone, making it imperative that all residues in the 5mm sieves in this site, were wet sieved using water under pressure.
RESULT
Artefact
 This chart shows that 41% and 33% of individual artefacts were never sighted in FXP1 and FXP2 respectively, over the the three seasons. Nineteen percent of artefacts only made on appearance in FXP1, but this percentage was slightly more in FXP2 (27%). the largest number of appearances was 15 times for one large artefact in FXP1. As can be seen from the chart on the left, most of the appearances were between zero and 5 instances. Only 15 artefacts collectively (7.5%) appeared on the surface between 6 and 15 times in the two sites.
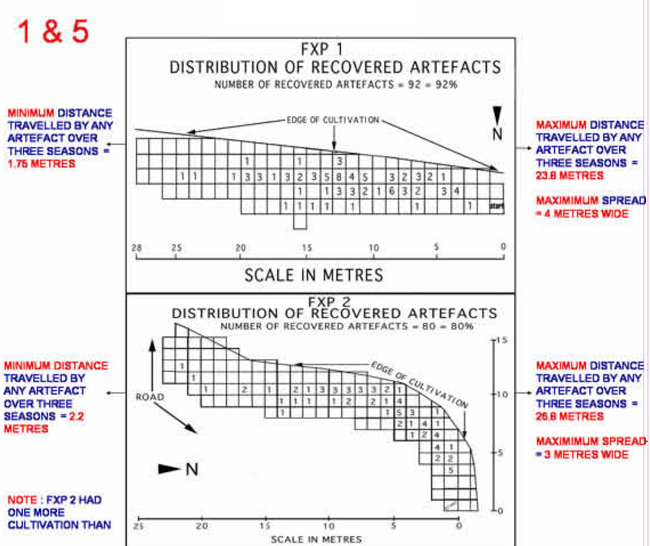
The non-appearance of many individual artefacts on the surface over the three seasons (42% in FXP1. and 33% in FXP2 suggests that over a 30 year period of cultivation, many artefacts would never bee seen on the surface. The extent of excavations required to recover 92% of the artefacts in FXP1(98 square metres) and to recover 80% of the artefacts in FXP2 (118 square metres) from their original square metre, suggests that excavation to locate and retrieve the majority of Aboriginal stone artefacts in a cultivation paddock would be a major undertaking. The “loss” of artefacts in such a short time in the research suggests that many may never be found.
Artefact Appearances per Season
Artefact Damage
Damage to artefacts was observed during the research and after excavation when a number of conjoins were made. There appeared to be two types of damage based on the shape of the break in the artefact.
They were:

Shear damage by a sharp object (most likely a plough disc passing over the artefact)

Breakage by weight (most probably by a tyre passing over the artefact)
The artefacts to the left appear to have had pressure applied to them causing them to break. They do not show the straight sharp edge profile as those that were caused by the plough disc as depicted in those to the right. The broken edges on the artefacts to the left, appear to be concave or convex in shape. The similarity between the break in the bottom artefact(down the centre) and a cone fracture (caused from too much force being applied when knapping) is striking. This suggests that caution should be exercised if a number of apparent cone fractures are found in artefacts observed in cultivated land.
Does Size Matter?
One would suspect that the overall size of the artefact should have some bearing on the distance that the artefact can be moved in any one cultivation.
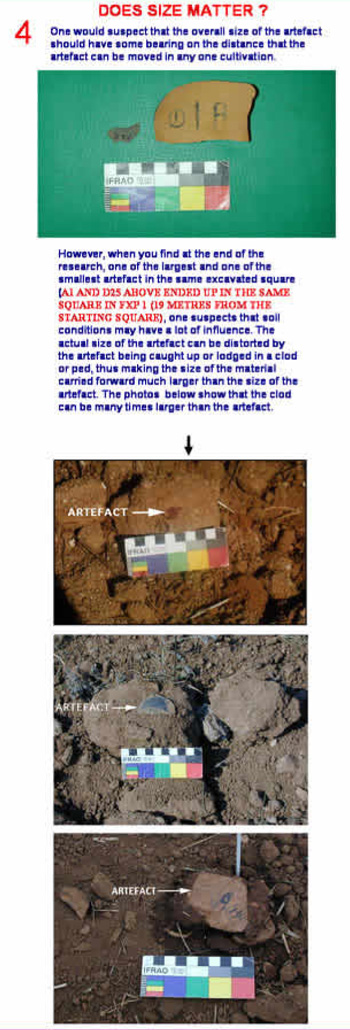
However, when you find at the end of the research, one of the largest and one of the smallest artefact in the same excavated square (A1 and D25 above ended up the same square in FXP1 (19 metres from the starting square), one suspects that soil conditions may have a lot of influence. The actual size of the artefact can be distorted by the artefact being caught up or lodged in a clod or ped, thus making the size of the material carried forward much larger than the size of the artefact.

THE DISTRIBUTION OF ARTEFACTS IN THE GRAPHS ABOVE SUGGEST THAT THE POTENTIAL DISTRIBUTION (LINEAR WISE) OF STONE ARTEFACTS (ORIGINALLY DISCARDED IN A METRE SQUARE) AFTER 30 YEARS OF CULTIVATION IN ONE DIRECTION IS FROM 22 TO 263 METRES.